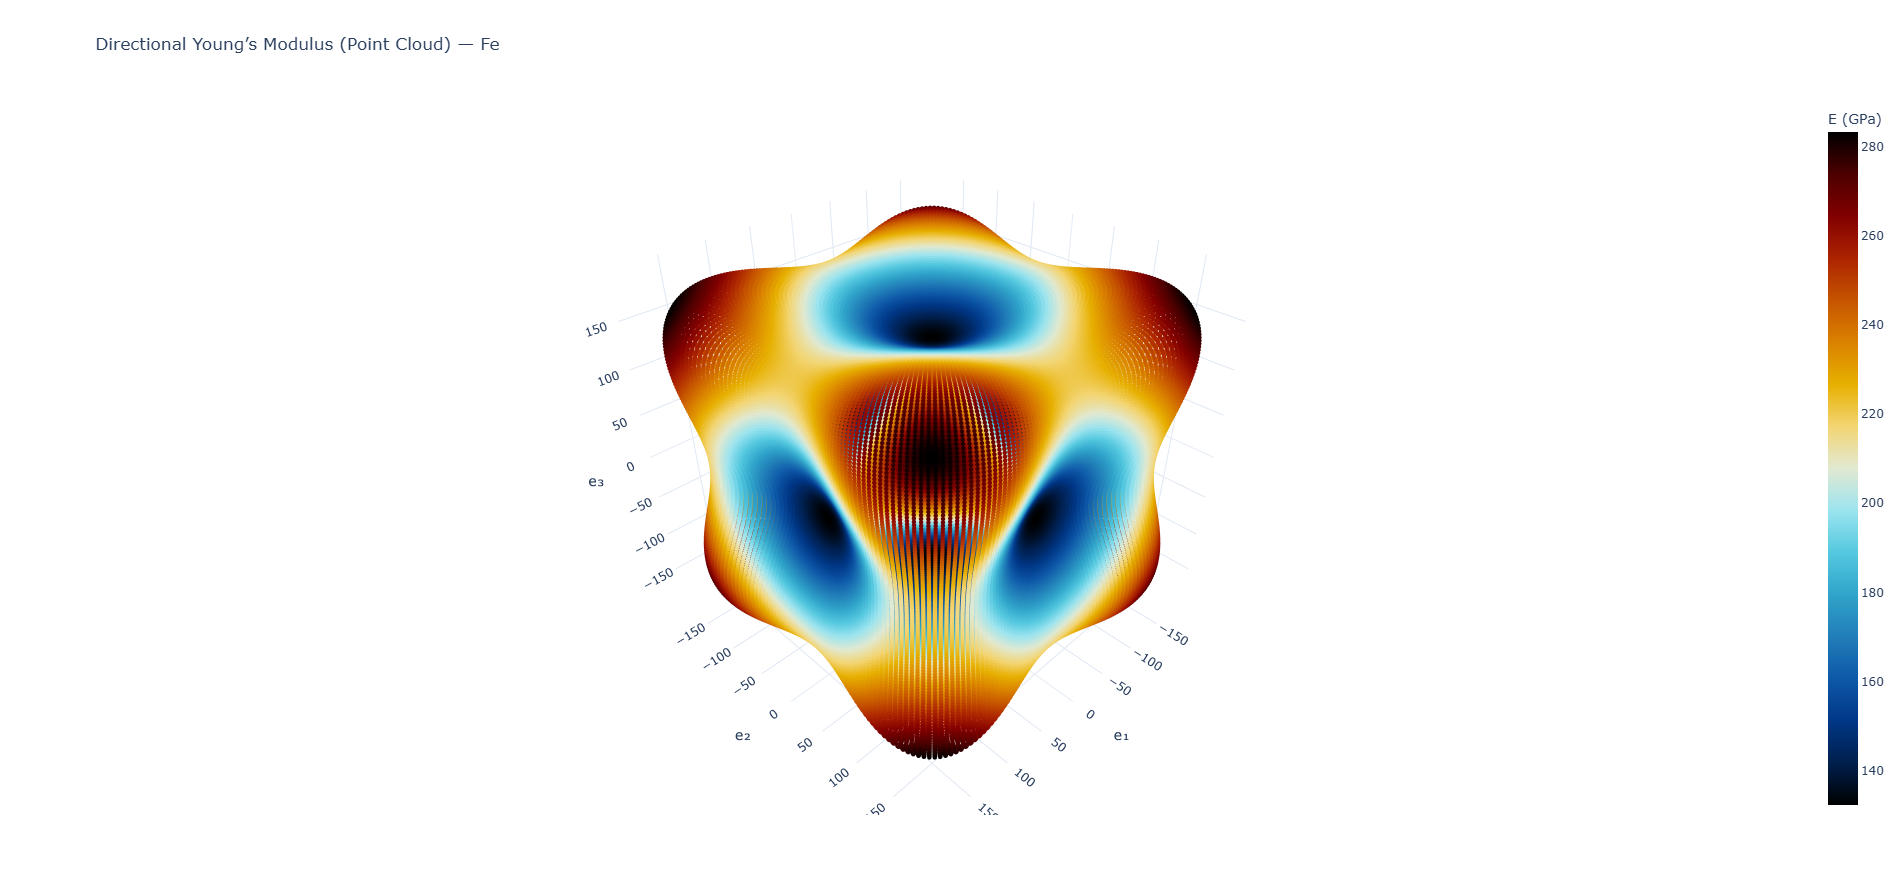
Fe — Directional E
Interactive point cloud r(θ,φ)=E(θ,φ)·d computed from cubic stiffness.
Selected highlights from assignments and exploratory analyses in solid mechanics. Interactive plots open as external pages. View the full codebase on GitHub.
Interactive point cloud r(θ,φ)=E(θ,φ)·d computed from cubic stiffness.
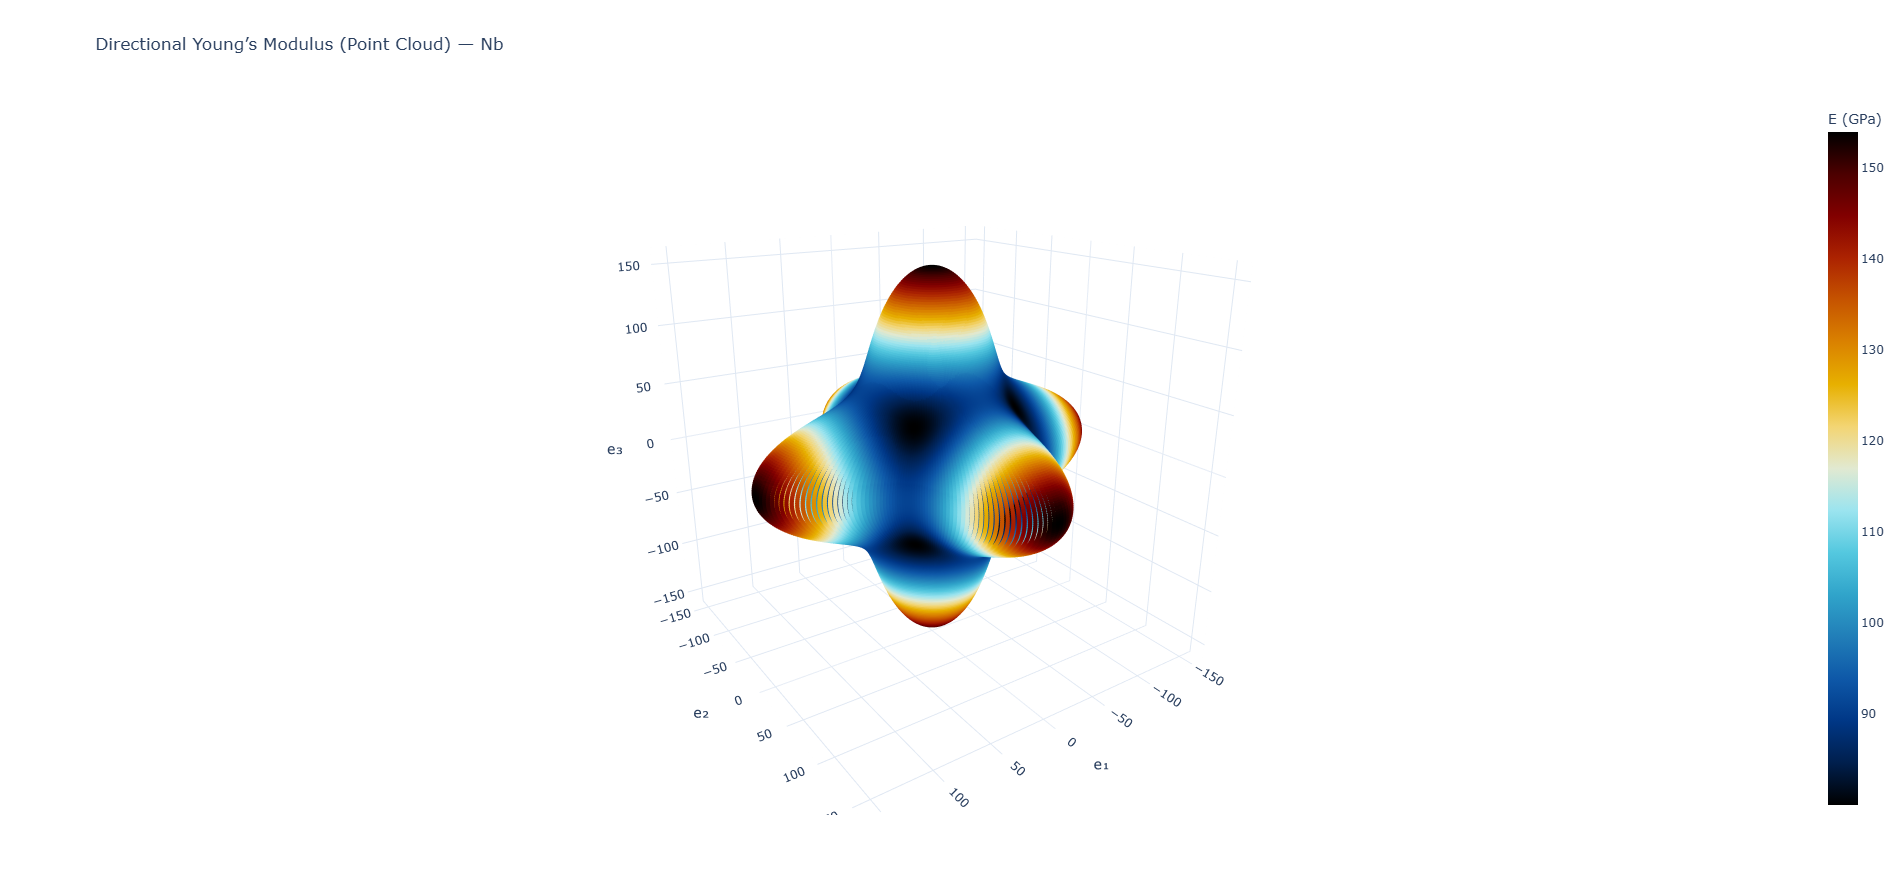
Explore anisotropy and directional stiffness for niobium.
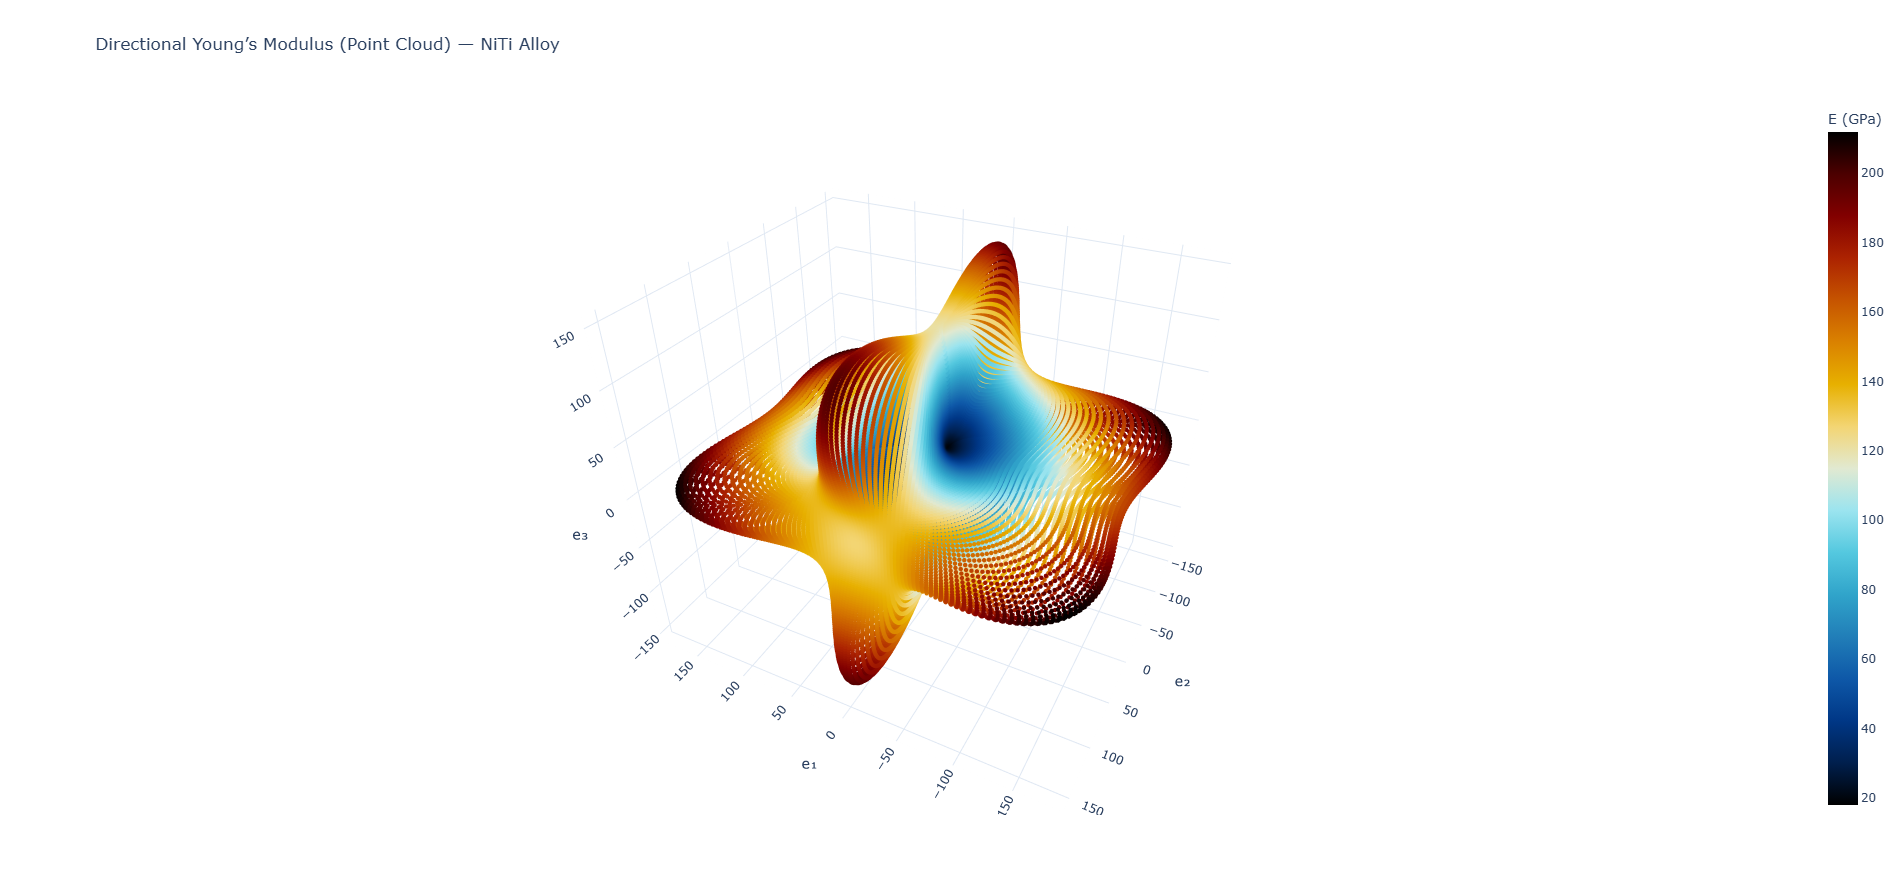
General anisotropic example; hover for E, θ, φ, and direction vector.
What These Plots Show: The directional Young's modulus E(d) quantifies how a material's stiffness varies with loading direction. Unlike isotropic materials (where E is constant), anisotropic materials like single crystals exhibit direction-dependent elastic properties. Each point in the 3D point cloud represents a direction vector d = (sin θ cos φ, sin θ sin φ, cos θ) in spherical coordinates, with the radial distance from the origin equal to E(d) in that direction. The color mapping (icefire colormap) visualizes the magnitude of E, revealing regions of high and low stiffness.
How They Were Computed: Starting from the 6×6 stiffness matrix C in Voigt notation, the algorithm: (1) computes the compliance matrix S = C⁻¹, (2) samples the unit sphere uniformly using 300×300 grid points in (θ, φ), (3) for each direction d, applies a unit stress in that direction via σ = d ⊗ d (in Voigt form), (4) computes the resulting strain ε = Sσ, and (5) evaluates the directional modulus as E(d) = 1/(d·ε·d). The point cloud is generated by plotting r(θ,φ) = E(θ,φ)·d, creating a 3D surface where distance from origin equals stiffness magnitude.
Material Differences: Fe (Iron) and Nb (Niobium) are cubic crystals with three independent elastic constants (c₁₁, c₁₂, c₄₄), resulting in symmetric 8-lobed patterns that reflect cubic symmetry. NiTi Alloy exhibits general anisotropy with a full 6×6 stiffness matrix, producing a more complex, less symmetric shape. The interactive plots allow rotation to inspect these crystallographic symmetries and reveal how material orientation affects structural response—critical for designing components from single-crystal or textured materials.
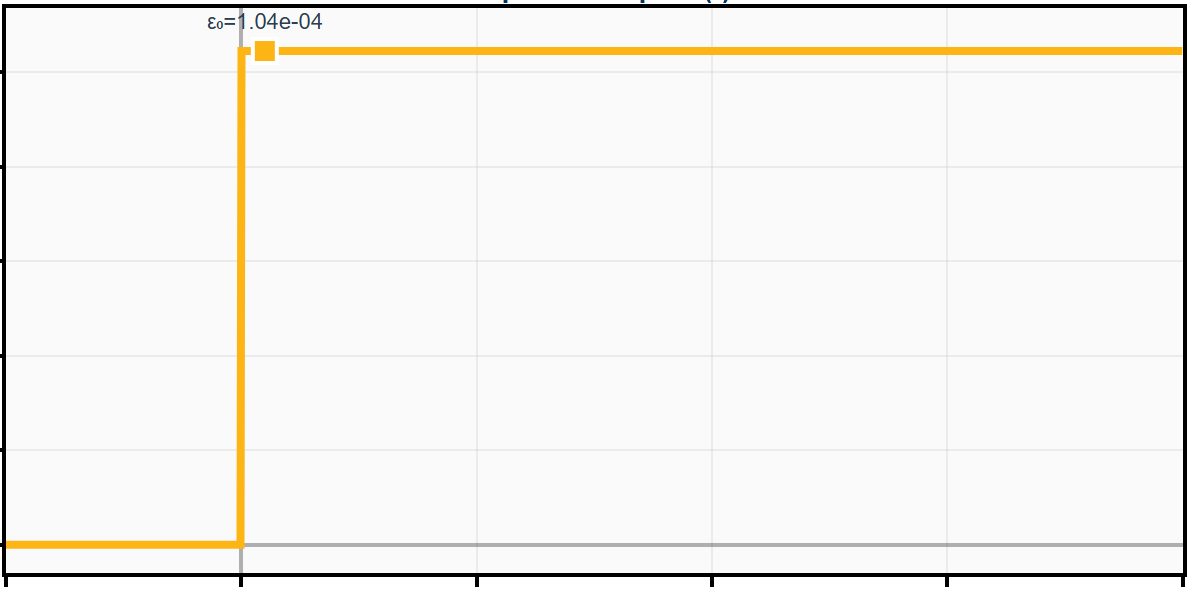
Interactive relaxation modulus and stress response to step strain input.
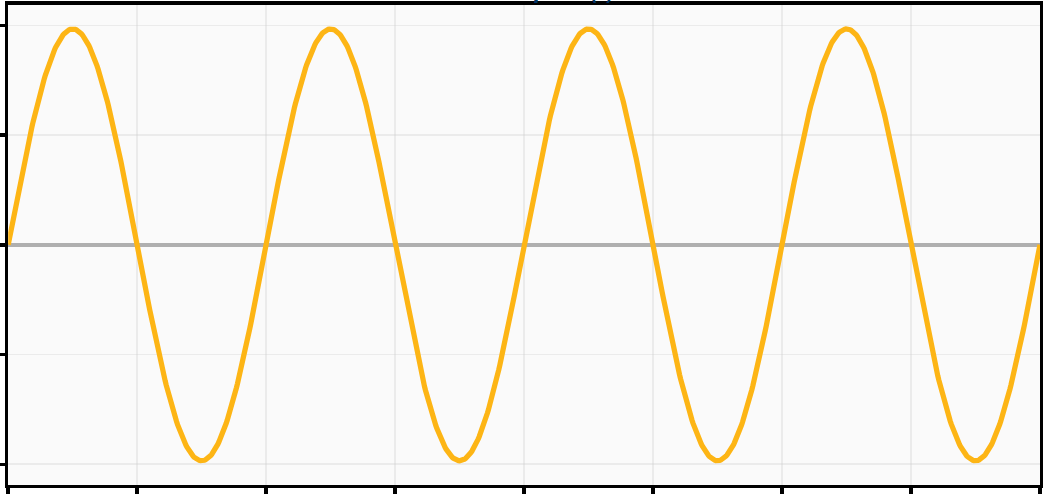
Standard Linear Solid subjected to harmonic strain; hysteresis loop visualization.
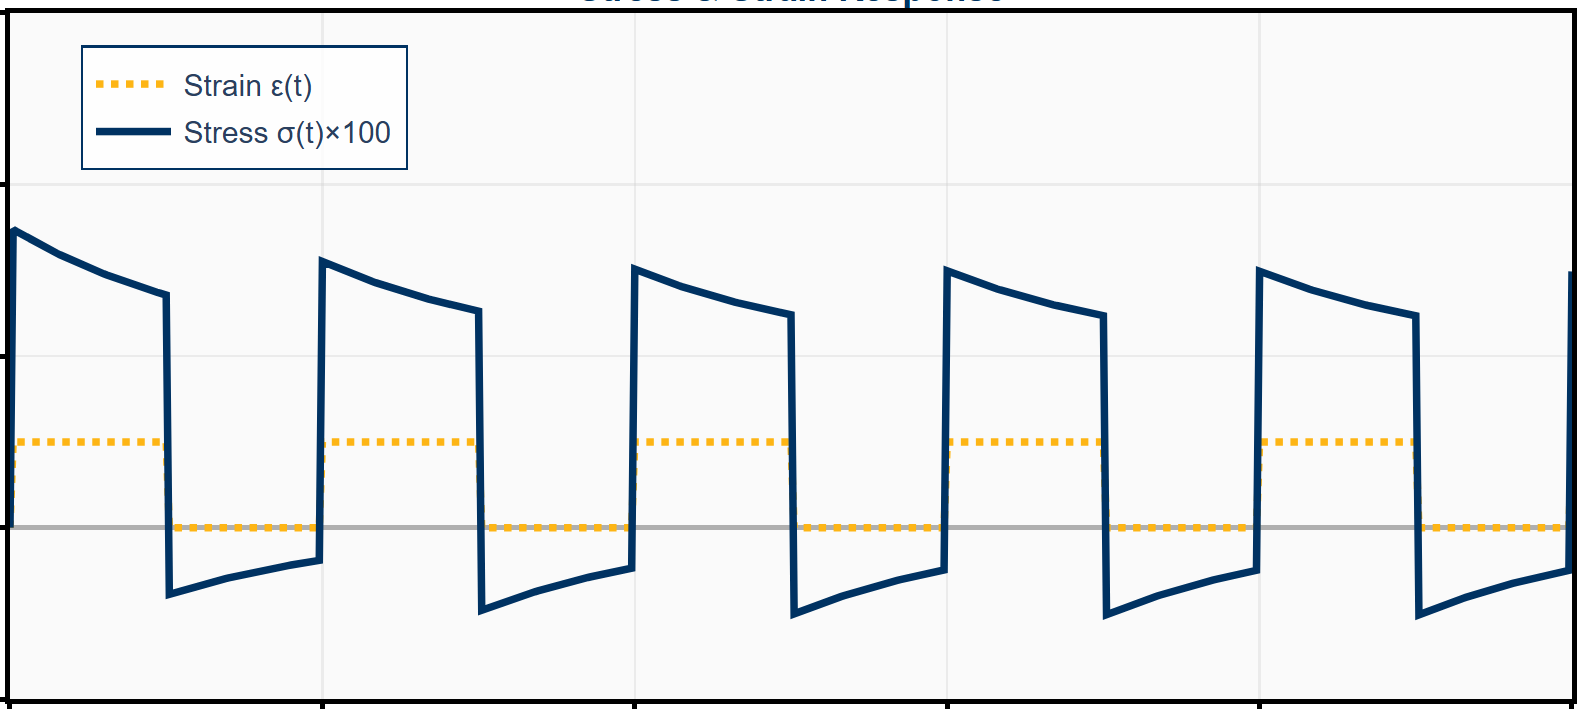
SLS with square wave strain; Backward Euler time integration and viscous strain evolution.
These dashboards explore time-dependent material behavior in viscoelastic solids. The Step Response shows relaxation of stress following an instantaneous strain. The Sinusoidal Response demonstrates energy dissipation through hysteresis loops under cyclic loading. The Square Wave Response implements Backward Euler time integration to capture transient viscous strain evolution. Each dashboard features interactive sliders to vary input parameters and observe real-time changes in stress-strain relationships.
The viscoelastic dashboards feature synchronized sliders to explore material response under different input parameters. Each dashboard includes stress-strain paths, characteristic values, and mathematical formulations.